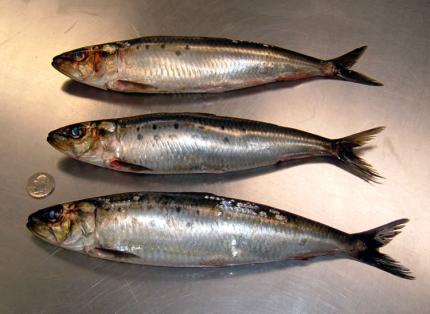
Aging sardine
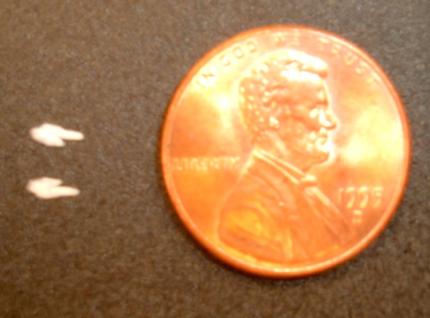
Reading sardine otoliths is the simplest and most reliable method for aging sardine. Scales and vertebrae can also be used but they are not as accurate as otoliths. Otoliths are found in pairs in the top of the head of a sardine just under the skull cap. Determining sardine age is similar to counting the rings in a tree. Age readers magnify the otoliths until they can count the rings, or annuli, and determine the age of the sardine.

Otoliths, which measure about 1.5-3.0 mm in length, are extracted and sent to the WDFW laboratory in Olympia, Washington, for age reading. Catch date, vessel name, sardine length (mm), weight (g), sex, and maturity are also recorded and sent along with the otoliths.
Although sardine can live up to 15 years the majority of commercially harvested sardine are three to five years old.
Washington Department of Fish and Wildlife (WDFW) staff coordinate the collection of biological sampling with Oregon Department of Fish and Wildlife staff to ensure sample coverage is evenly distributed throughout the Northwest fishery


Length and weight
Sardine size varies from year to year depending on the current year class of sardine. Sardine caught in Washington's seine fishery range in size from 100 mm to 300 mm although the average length of sardine in Washington's fishery is typically 175-225 mm. The weight of sardine in Washington's fishery can be as small as 80 grams and as large as 300 grams but the average weight of sardine in our fishery is 150-175 grams. The average length and weight of sardine from 2008 to 2014 can be seen in the following bar graph.
